Open database on Scientific visualisation
Open database on scientific visualisation
Open database on scientific visualisation
The open database on scientific visualisation is a selection of datasets that put an emphasis on the scientific visualisation of their data. The rendering is done through the ParaView software.
The database can be viewed by searching for the "scientific_visualisation" tag which is attached to all the datasets of that database. It is displayed as a gallery of thumbnails of each visualisation.
As part of the database, each dataset comprises of at least:
- The data
- The visualisation file from ParaView (.pvsm)
- The preview file
Any dataset can be part of this database and use that tag if those files above are present, so think about your data visualisation when you upload a dataset!
Browse through the open database of scientific visualisation
Browse through the open database of scientific visualisation
Type "scientific_visualisation" in the search bar of the platform to browse through the gallery of datasets in the database.
If you are interested by a visualisation or some aspects of it, you can click on the dataset in the gallery and download the .zip file. You can then follow these steps to load the dataset in ParaView:
- Extract the .zip file into a folder of your choosing.
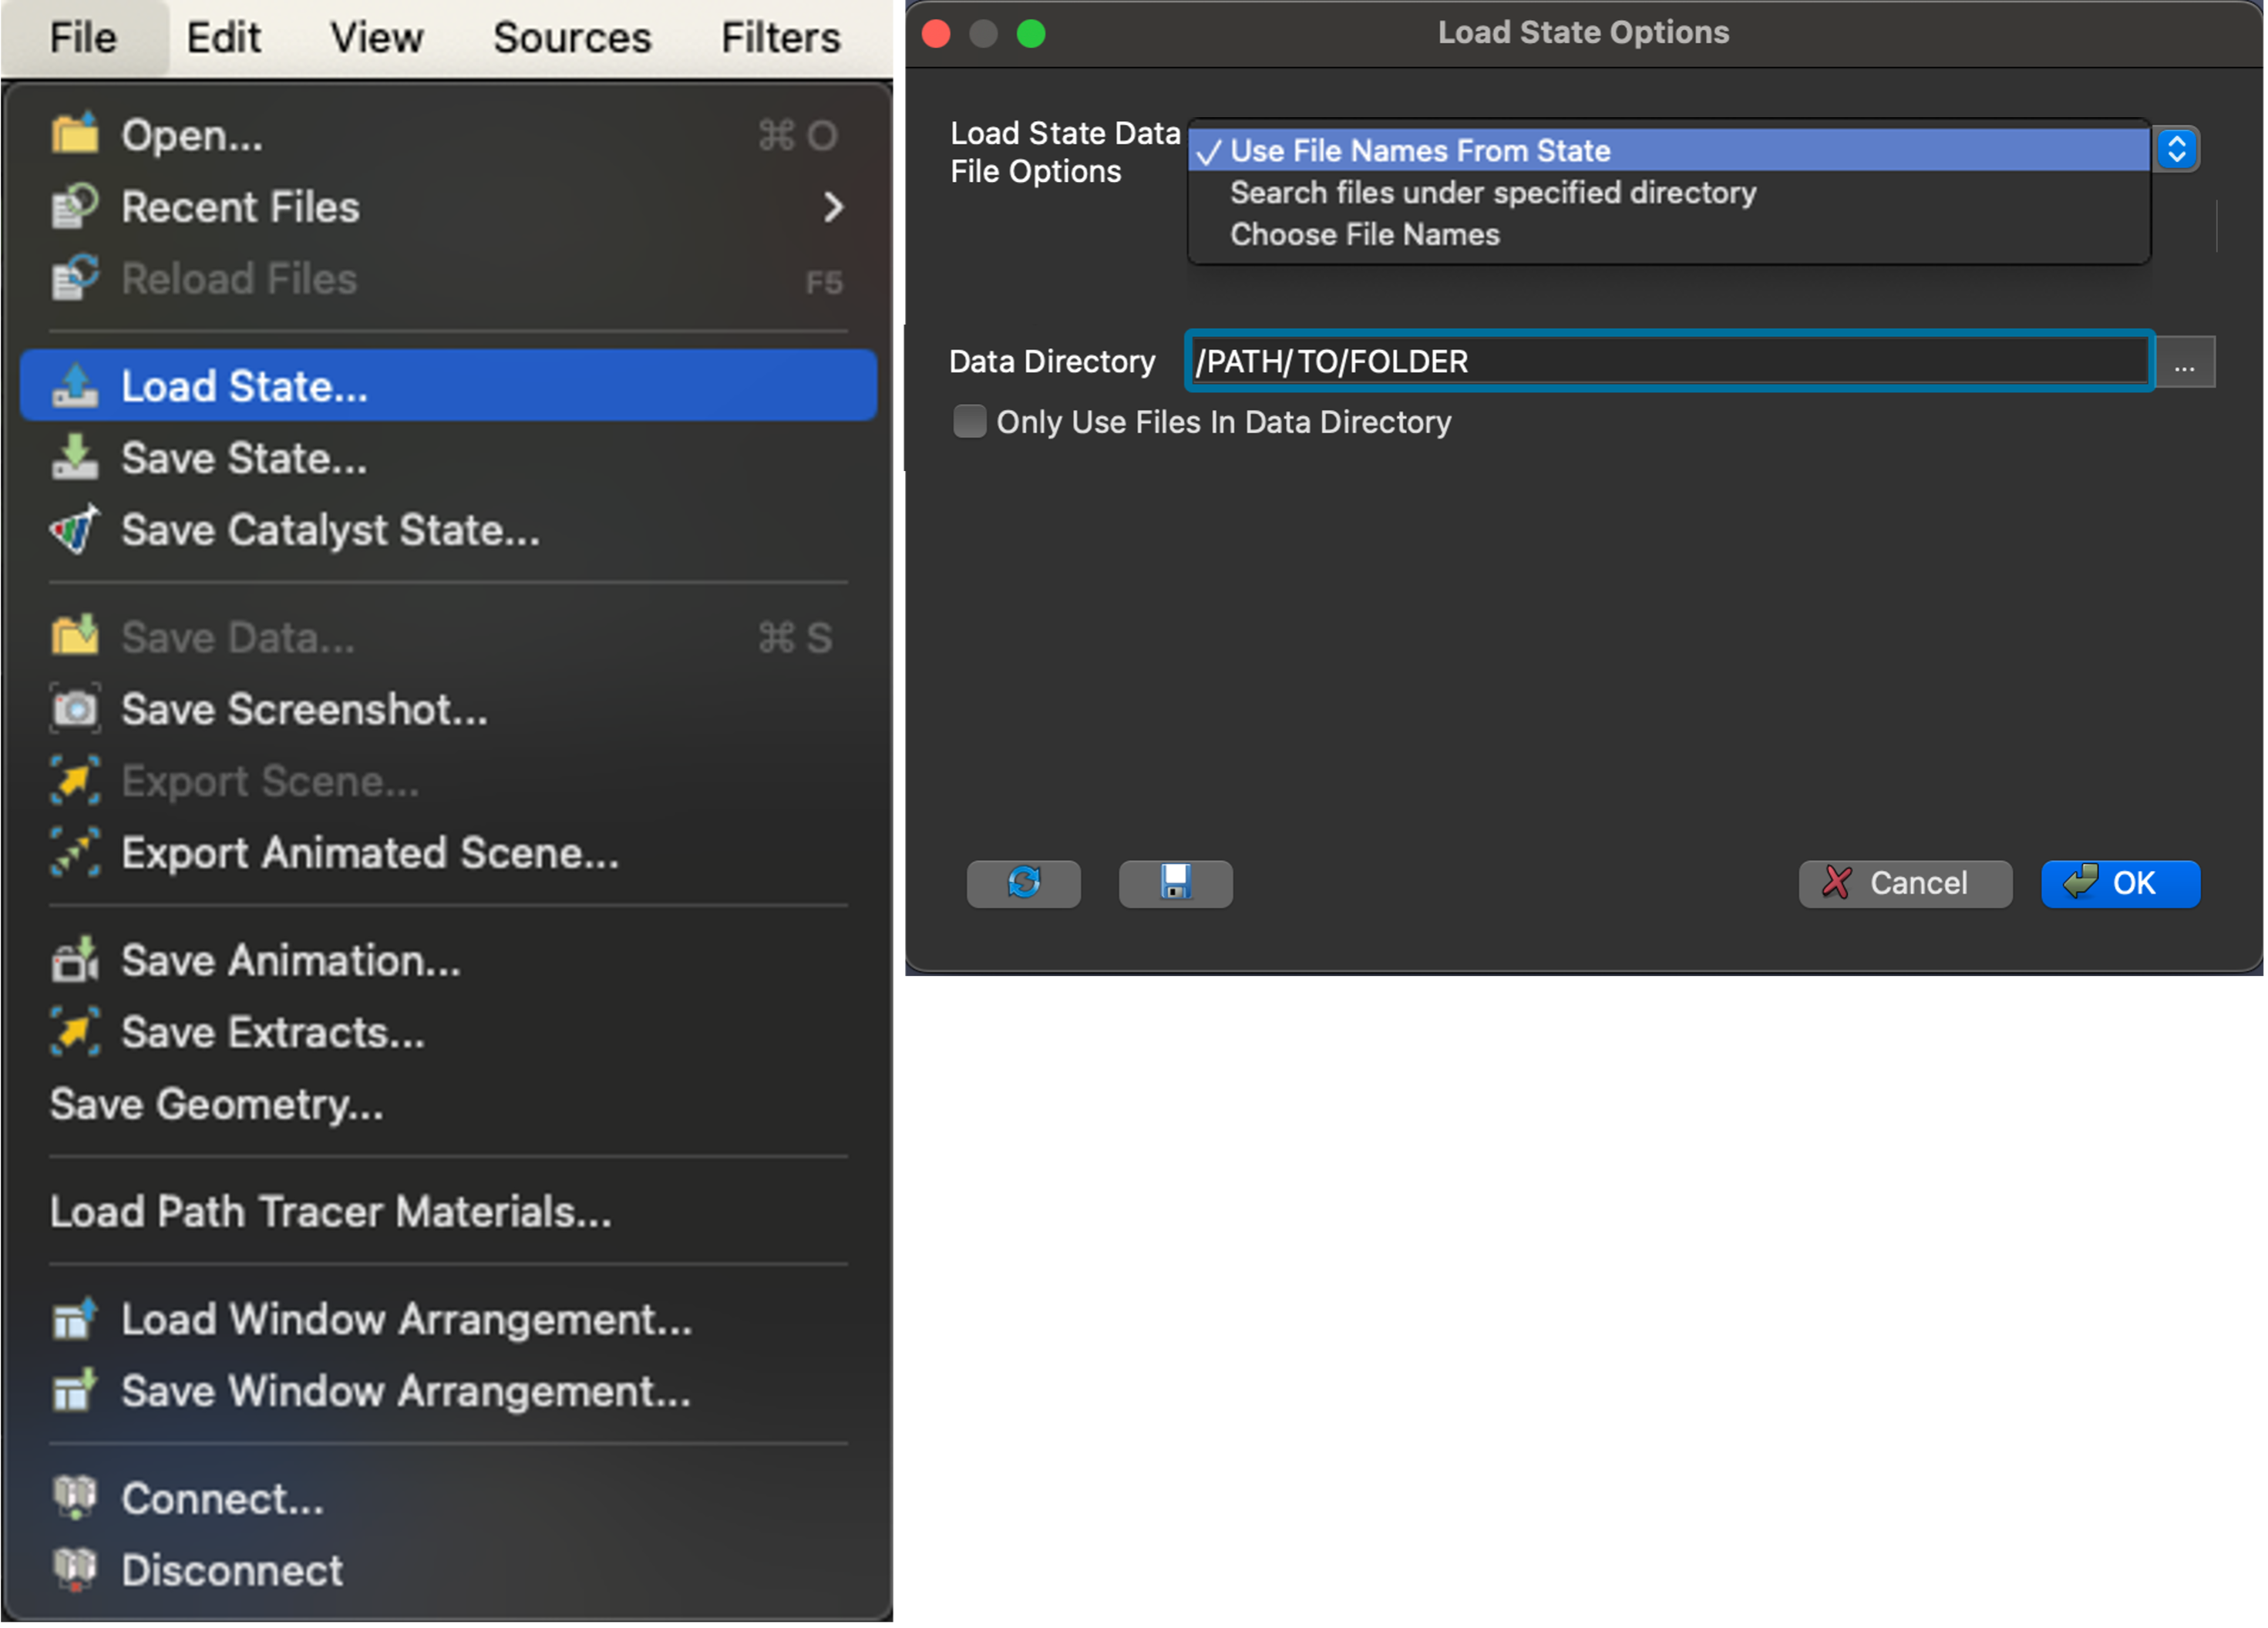
- In ParaView, open the pvsm file with File → Load State.
- Browse to the extracted zip folder and select the .psvm file.
- Select the option 'Search files under specified directory' and set the Data directory as the extracted zip folder.
- Note that when encountering any problems, it is also possible to manually select the visualisation files with the 'Choose File Names' option.
You can play the animation with ParaView with the play button on top of your screen. The Pipeline browser provides an overview of how the data visualisation is created.
Create the scientific visualisation of your data
Create the scientific visualisation of your data
To create the scientific visualisation of your data:
- Open your dataset in ParaView.
- Apply the correct settings for your data and adequate options on selected filters until you are satisfied with the visualisation.
Save the visualisation files
Save the visualisation files
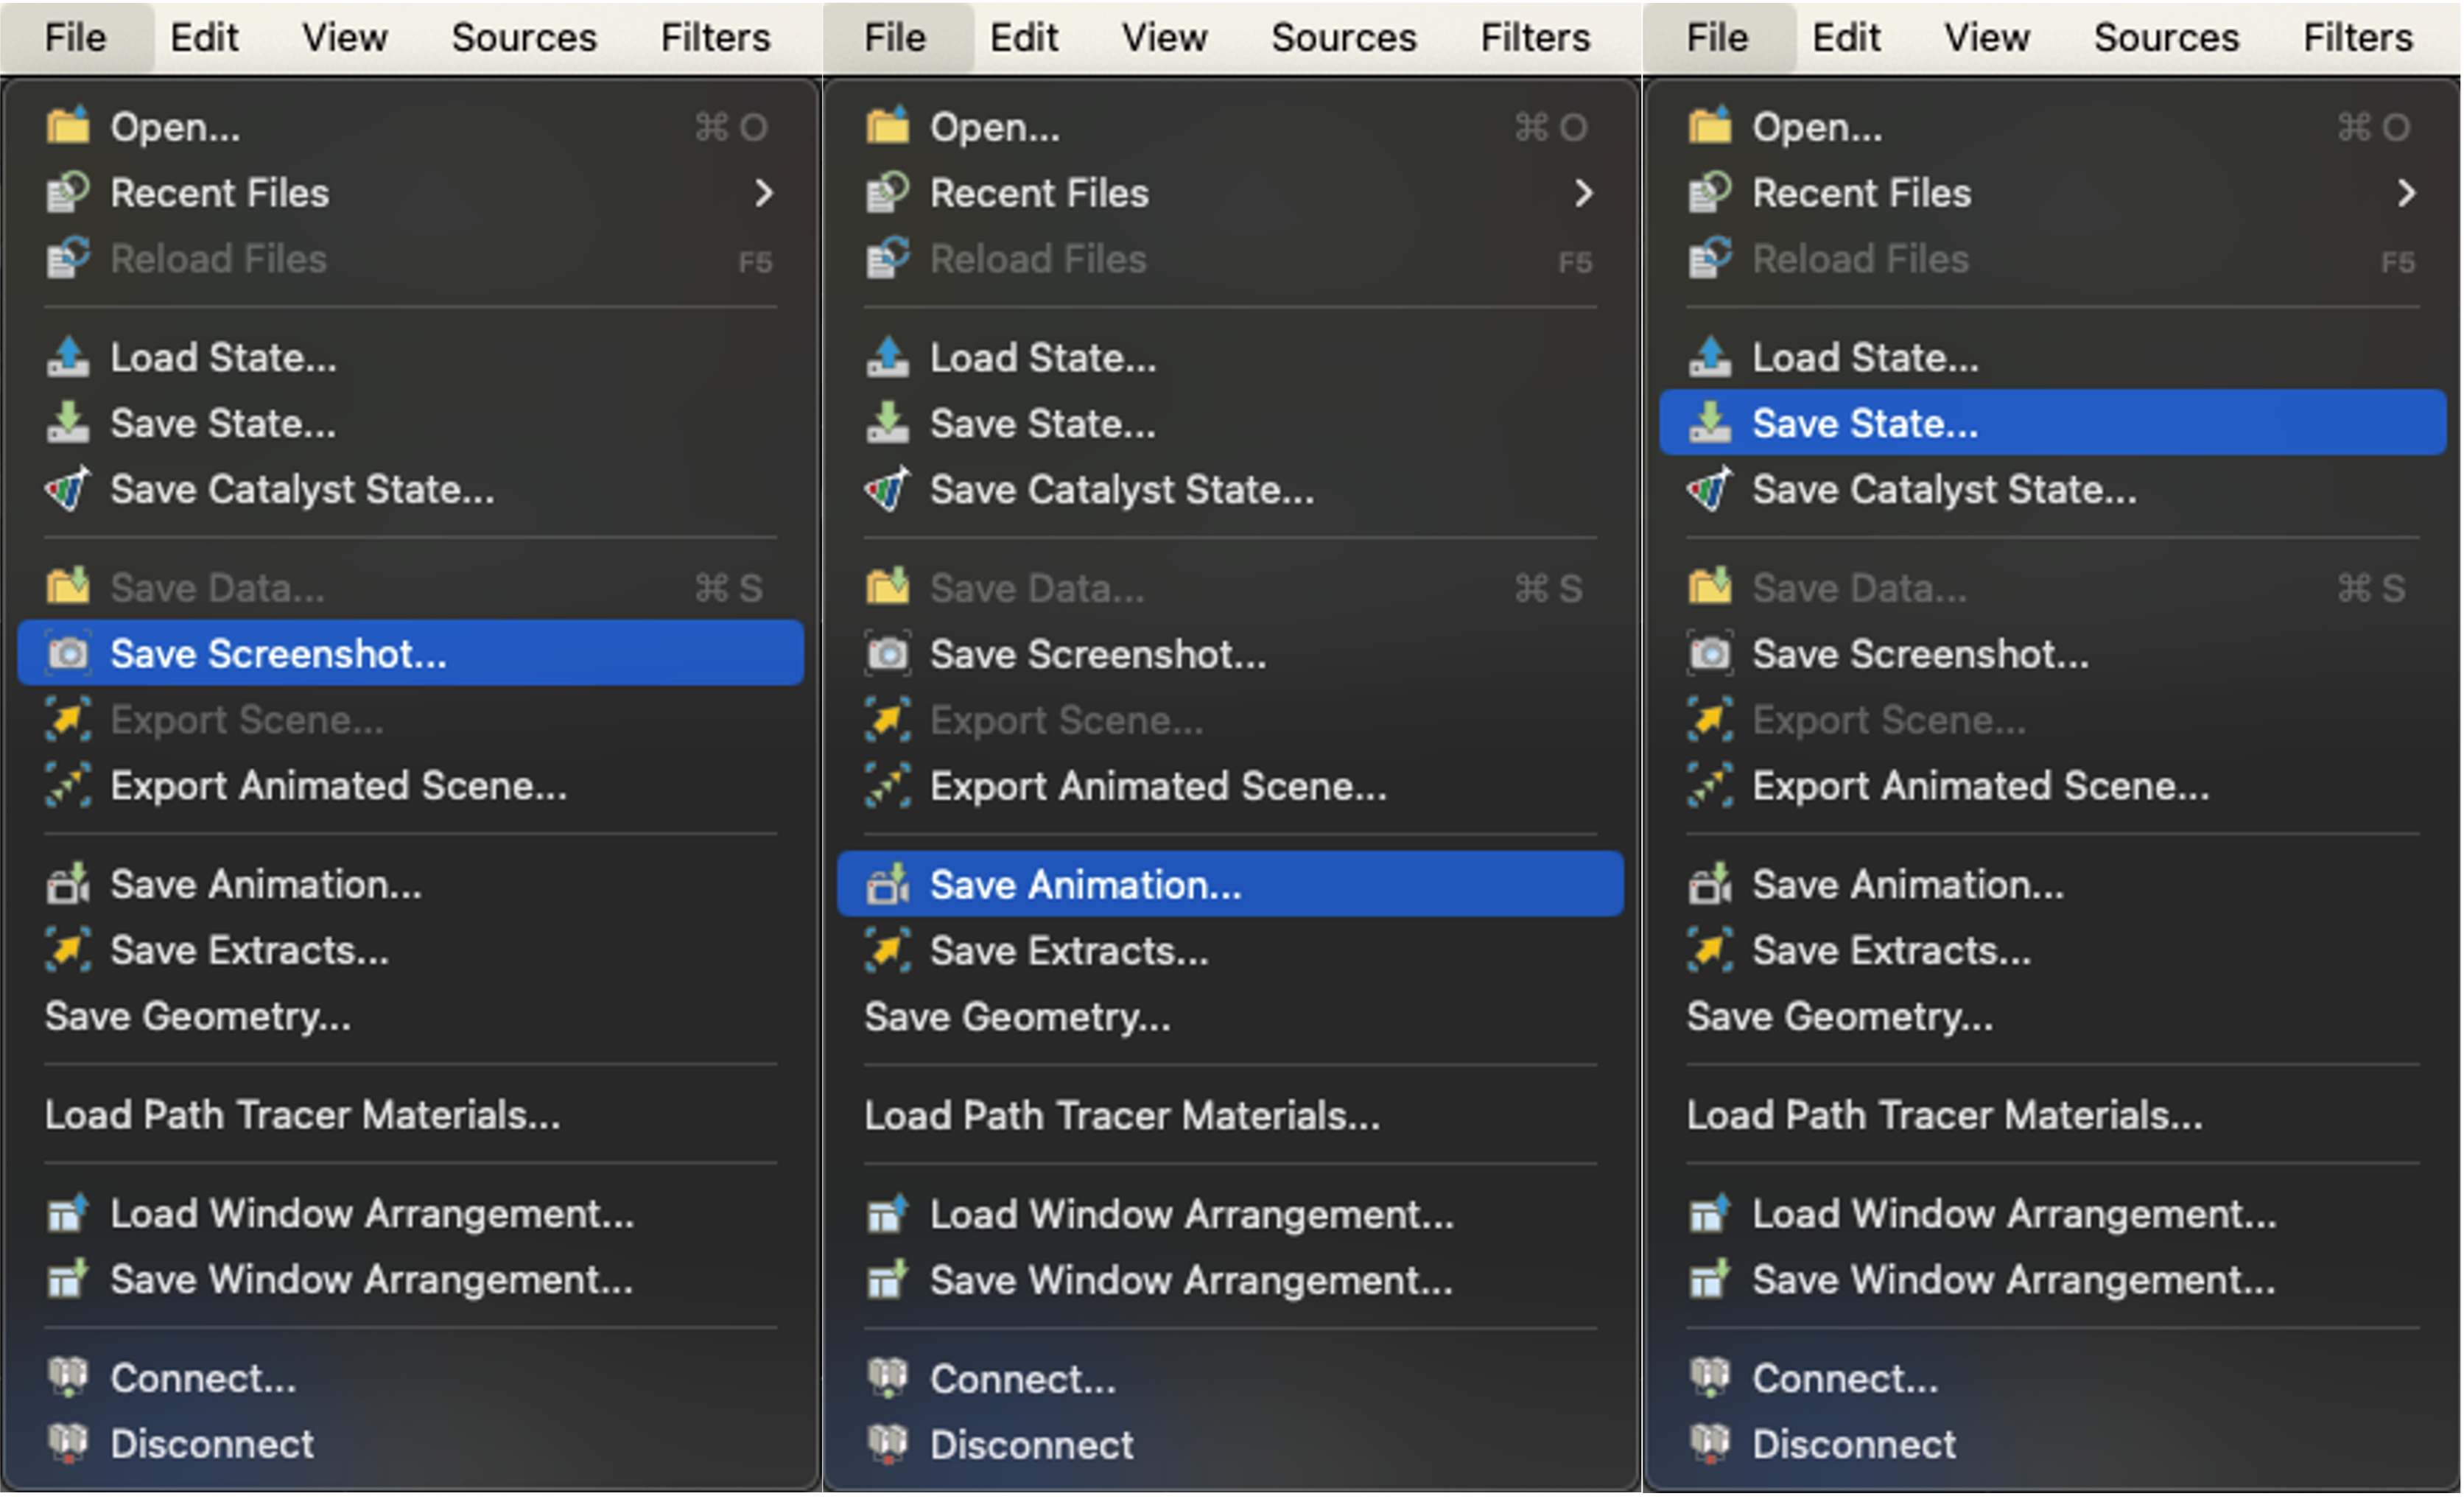
Find a nice angle and zoom level for the camera in the rendered view then save the preview file with: “File → Save Screenshot” (we do not require high quality for the thumbnail, it is displayed as 300x300).
Note that the thumbnail supports GIF format. If your visualisation is animated, you can use “File → Save Animation” instead. The GIF can be created with any tool, including online GIF makers.
Save the state of the window so that others could go through the settings and options you have used, with: “File → Save State”.
Upload a dataset in the open database of scientific visualisation
Upload a dataset in the open database of scientific visualisation
To upload a dataset in the open database of scientific visualisation:
- Follow the normal steps to upload a dataset on 4TU.ResearchData.
- On top of the data, upload also the visualisation file from ParaView and the preview file.
- Select your preview file as the thumbnail.
- Add the tag "scientific_visualisation" to the dataset.
- Add the tag “Paraview_XXX” with the version of the ParaView software you have created the visualisation with.
- Add relevant tags that categorises your visualisation. Examples include "flow", "mechanics", "dissolution/precipitation", "transient", "steady", etc.
About the open database of scientific visualisation
About the open database of scientific visualisation
The discipline of computational modelling, taught in various forms in every educational program, remains purely virtual. Its teaching can become too abstract for students who lack manual interactivity. The absence of visual feedback can prevent students from relating to their topic as well as the opportunity to inspect their model to check its validity and be able to present their results to the teachers. To fill this gap, we turn to the field of scientific visualisation, which provides an external aid to improve interpretations of results. In this project, we propose to create an open database for scientific visualisation to educate students on how to use those methods in their courses. This constitutes the first self-education resource available in this domain. Students are now able to browse a collection of examples of similar projects uploaded by researchers or students who have already graduated, from which they can find inspiration for their own projects.
This database was created in collaboration with this platform 4TU.ResearchData as part of the grant of Open Education Stimulation Fund 2022. The investigators of this project are:
- Martin Lesueur, Assistant Professor, TU Delft
- Sijmen Zwarts, PhD Candidate, TU Delft
- Oriol Colomés, Assistant Professor, TU Delft
- Frans van der Meer, Associate Professor, TU Delft
Feedback
Feedback
To enhance both the database functionality and the clarity of its usage instructions, please take a moment to share your feedback through this form.


